[adsense:responsibe:9545213979]
Problema A9.8 pag660 OGATA
Solapas principales
Vamos a calcularle un compensador que nos haga cumplir los siguientes requisitos  , margen de fase =50 y margen de ganancia
  al siguiente sistema en lazo abierto:
![]()
-
Vamos a calcular K y


-
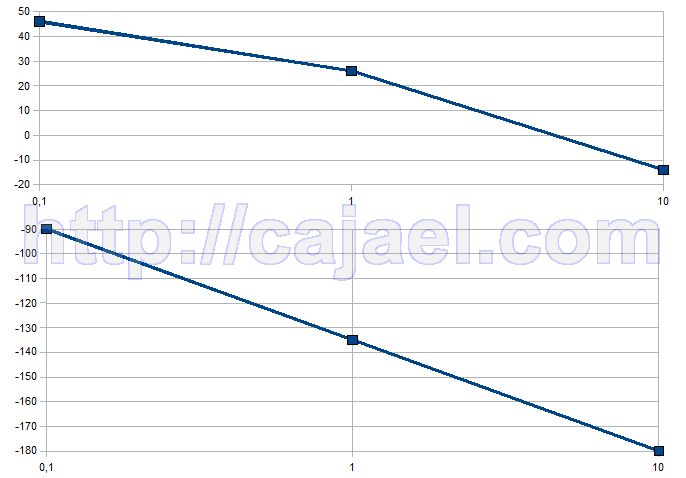
Vamos a hacer el diagrama de bode de

w 

s 1 0.1 10 
1 0.1 10 


w 0.1 1 10 
46.02 26.02 -13.98 
-90 -135 -180 
-
Como se ve necesitamos un compensador de adelanto para que el margen de fase sea 50
-
Vamos a calcular el margen de fase y la fase del compensador (
 )
)


-
Calculamos el
 del compensador


-
Calculamos el T del compensador


 Este valor 6.76 sera la nueva frecuencia de corte.


-
Calculamos la
 del compensador
 Con lo que el compensador nos queda:
-
Ahora vamos a comprobar el margen de ganancia verifica
 Al haber insertado en el sistema con el compensador un cero y polo, sus fases a altas frecuencias se anulan (90-90) con lo que el sistema queda como al inicio -180 a altas frecuencias casi en el
 con lo que el margen de ganancia va ha ser muy elevado con lo que
  .
.
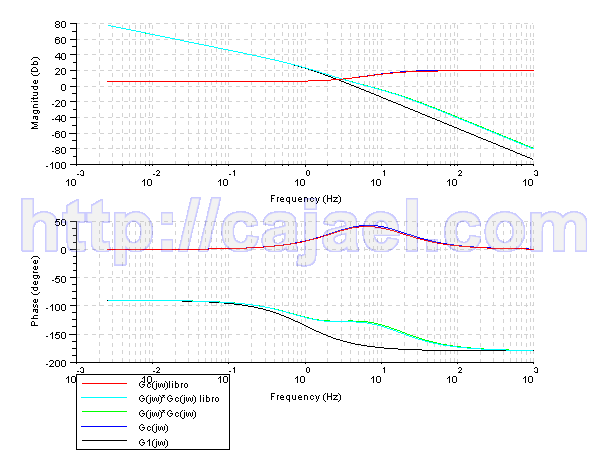
Vamos a representar el diagrama de Bode de todas las funciones mediante Scilab
s=%s/(2*%pi);
g=10/(s*(s+1))
gc=10.49*(s+2.95)/(s+15.5);
gt=g*gc;
gc2=9.5238*(s+2.9787)/(s+14.1842);
gt2=g*gc2;
gs=syslin('c',2*g);
gcs=syslin('c',gc);
gcs2=syslin('c',gc2);
gts=syslin('c',gt);
gts2=syslin('c',gt2);
clf();
bode([gs;gcs;gts;gts2;gcs2],['Gc(jw)libro';'G(jw)*Gc(jw)libro';'G(jw)
*Gc(jw)';'Gc(jw)';'G1(jw)' ]);

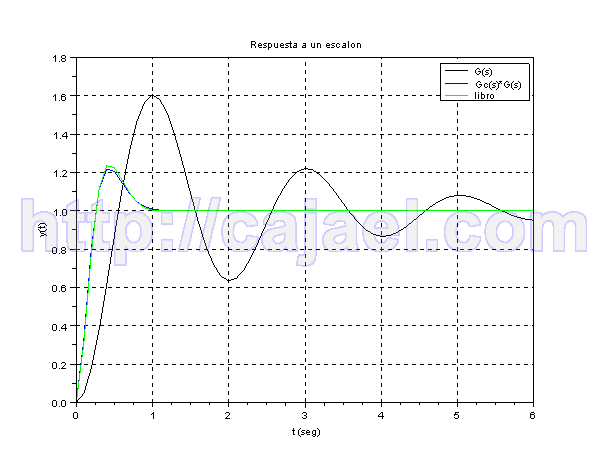
Vamos a representar la respuesta a un escalon mediante Scilab
s=%s;
g=10/(s*(s+1))
gc=10.49*(s+2.95)/(s+15.5);
gt=g*gc;
gc2=9.5238*(s+2.9787)/(s+14.1842);
gt2=g*gc2;
glc=g /. 1;
gtlc=gt /. 1;
gtlc2=gt2 /. 1;
gs=syslin('c',glc);
gcs=syslin('c',gtlc);
gcs2=syslin('c',gtlc2);
t=0:0.1:6;
y=csim('step',t,gs);
y1=csim('step',t,gcs);
y2=csim('step',t,gcs2);
clf();
plot(t,y,'k');
plot(t,y1,'b');
plot(t,y2,'g');
xtitle('Respuesta a un escalon','t (seg)','y(t)');
legends(['G(s)';'Gc(s)*G(s)';'libro'],[1,2,3],opt=1);
xgrid;

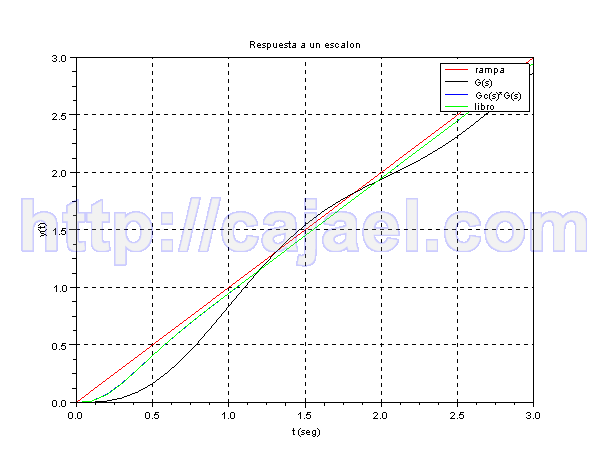
Vamos a representar la respuesta a una rampa mediante Scilab
s=%s;
g=10/(s*(s+1))
gc=10.49*(s+2.95)/(s+15.5);
gt=g*gc;
gc2=9.5238*(s+2.9787)/(s+14.1842);
gt2=g*gc2;
glc=g /. 1;
gtlc=gt /. 1;
gtlc2=gt2 /. 1;
gs=syslin('c',glc);
gcs=syslin('c',gtlc);
gcs2=syslin('c',gtlc2);
t=0:0.1:3;
y=csim(t,t,gs);
y1=csim(t,t,gcs);
y2=csim(t,t,gcs2);
clf();
plot(t,t,'r');
plot(t,y,'k');
plot(t,y1,'b');
plot(t,y2,'g');
xtitle('Respuesta a una rampa','t (seg)','y(t)');
legends(['rampa';'G(s)';'Gc(s)*G(s)';'libro'],[color('red'),1,2,3],opt=1);
xgrid;

Español


Añadir nuevo comentario